This article was first published on SearchServerVirtualization.TechTarget.com.
VM Profiling and Load Distribution
Managing performance is a key requirement in systems administration. And, when it comes to virtualization (where multiple independent OS’s are competing for system resources), it’s even more important. The key is to measure and monitor real-world performance of your applications. However, this is often easier said than done. In this article, I’ll cover some details and approaches for monitoring performance of your physical and virtual machines. The goal is to make better decisions related to virtualization performance and load distribution.
Monitoring Real-World Performance
When measuring performance, it’s important to keep in mind that the best predictions can be made by using real-world activity. For example, if you’re planning to move a production line-of-business application from a physical server to a virtual one, it’s best to have a performance profile that highlights production load as closely as possible. Or, if you’re developing a new application, expected workload information can be instrumental in making better decisions. All too often, systems administrators take the approach of trail by fire: “If there are performance problems, we’ll address them when users complain.” So, that raises the question of how you can collect realistic performance data.
IT organizations that have invested in centralized performance monitoring tools will be able to easily collect CPU, memory, disk, network, and other performance statistics. Generally, this information is stored in a central repository, and reports can be generated on-demand.
Alternately, there’s a “manual” approach. Since most operating systems provide methods that allow for capturing performance statistics over time, all that’s required it to setup those tools to collect the relevant information. For example, Figure 1 shows options for tracking server performance over time using the Windows Performance Tool. Details related to key performance statistics such as CPU, memory, disk, and network utilization can be collected over time and analyzed. You’ll want to pay close attention to the peaks and the average values.
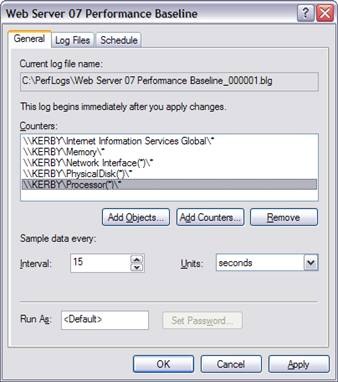
Figure 1: Capturing performance data using the Windows System Monitor tool.
Performing Stress-Testing
If you’re deciding to migrate an existing application to a virtual environment, you can monitor its current performance. But what if you are considering deploying a new application? That’s where stress-testing comes in. Some applications might include performance testing functionality as part of the code-base. For those that don’t, there are numerous load-testing tools available on the market. They range from free or cheap utilities to full Enterprise performance-testing suites. For example, Microsoft provides its Application Center Test (ACT) utility to test the performance of web applications and report on a number of useful metrics.
You can predict approximate performance by running the application within a VM and measuring response times for common operations, based on a variety of different types of load. There are two main goals: First, you want to ensure that the expected workload will be supported. Second, you want to make sure that no unforeseen stability or performance problems arise.
Using Benchmarks
It’s no secret that virtualization solutions typically present some level of overhead that reduces the performance of virtual machines. The additional load is based on the cost of context-switching and redirecting requests through a virtualization layer. Unfortunately, it’s very difficult to provide a single number or formula for predicting how well an application will perform in a virtual environment. That’s where synthetic performance benchmarks can help. The operative word here is synthetic – meaning that the tests will not provide real-world usage information. Instead, it will give you information related to the maximum performance of the hardware given a pre-defined workload. An example of a suite of benchmark tools is SiSoft Sandra 2007 (a free version is available from SiSoftware). Many other tools are available from third-party vendors. It’s important to stay consistent with the tools used, since results from different products (and often, versions) cannot be accurately compared.
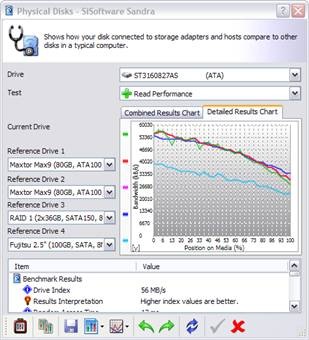
Figure 2: Viewing results from a physical disk benchmark performed with SiSoftware’s Sandra 2007.
The general approach is to run similar tests on both physical hardware and within virtual machines. If the tests are run on the same or similar hardware configurations, they can be reliably compared. Table 1 provides an example of typical benchmark results that might be obtained by testing a single operating system and application in physical versus virtual environments. A quantitative comparison of the capabilities of each subsystem can help determine the amount of “virtualization platform overhead” that can be expected.
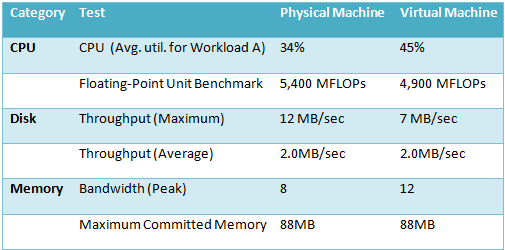
Table 1: Comparing VM and physical machine performance statistics.
Distributing VM Load
One of the main benefits of virtualization is that of portability: It’s usually fairly simple to move an VM from one host server to another. Ideally, once you profile your physical and virtual machines, you’ll be able to determine general resource requirements. Based on these details, you can mix and match VMs on host computers to obtain the best performance out of your physical hardware.
Table 2 provides an example a simple table that shows high-level requirements for some hypothetical VM workloads. Ideally, the load will be distributed: For example, those VMs that have high CPU requirements can be placed on the same physical host as those that are disk-intensive. The end result is a more efficient allocation of VMs based on the needs of each workload.
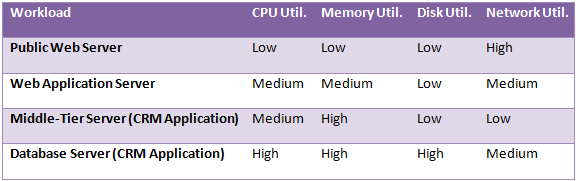
Table 2: Comparing high-level information about various virtual machine workloads.
Making Better Virtualization Decisions
Overall, a little bit of performance testing can go a long way toward ensuring that your VMs will work properly in a virtual environment. By combining data from real-world performance tests with stress-testing results and synthetic benchmarks, you can get a good idea of how to best allocate your VMs.
